
2. What are the three important indications in all momentum oscillators?


3. How do momentum oscillators show direction of price moves?
4. Which M. 0's produce false signals?
5. How can M. 0's indicate a reversal of the prior trend?
6. What are the areas of extreme value called?
7. When does divergence occur?
8. What is the formula of Moving Average Spreads?
Exercises
Ex. 1. Put questions to the underlined words.
Ex. 2. Find verbals and state their syntactical function in the sentence.
Ex. 3. Select sentences which are difficult to translate and make a syntactical analysis of them.
Ex. 4. Analyse noun collocations according to the models given in the Reference Grammar.
Ex. 5. Read and translate the text.
| TRANSLATION PRACTICE Momentum Crossover Analysis The Momentum Crossover analysis, which can be created in the User defined analysis modules of Reuters Technical Analysis and Reuters Technical Analysis for Unix, combines the trend direction characteristics of the simple moving average and the trend strength capabilities of the momentum analysis. Two of these analyses used together can produce effective buy and sell signals. | Vocabulary ou crossover trend direction - trend strength - | пересечение (трендов) - направление тренда - сила тренда |
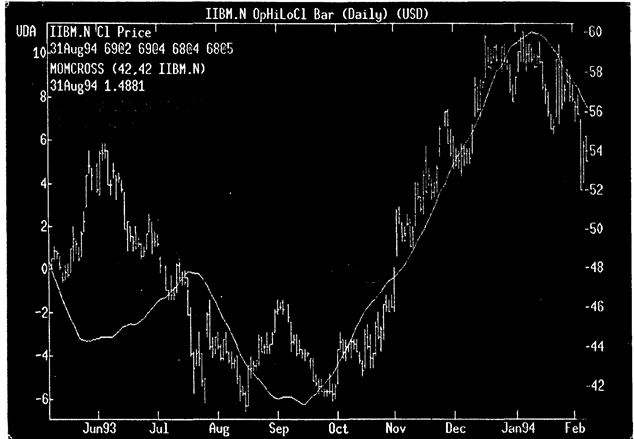
| The formula parameters are as follows and need to be filled in at the time of charting: vl —timeseries (instrument), nl — observation period for momentum (lag period), n2 — averaging period for moving average. The diagram shows a short and long momentum crossover analysis giving clear buy and sell signals. The momentum crossover analysis is simply a smoothed version of the standard momentum analysis. Two of these analysis on the same chart, one with a long, the other with a short averaging period can be used in the same way as two standard simple movine averages, (i.e. crossover indicates buy and sell signals) except that the lines will oscillate around zero. Uptrends are indicated bv price action below the momentum crossover lines. The momentum crossover line cutting through price after a trend has been established (up or down) indicates trend reversal. The analysis should not be used in a sudeways market as it tends to be choppy in the same manner as ordinary moving averages. To create the Momentum crossover analysis, simply add the following formula into the UDA editor of either RTA or RTAu. Then graph the momentum crossover twice with differing length averaging and observation periods overlaid with a price chart. The momentum and moving average oeriod parameters should be the same as those used for short and long moving average crossovers for the instrument you are trading. Exercises Ex. 1. Put questions to the underlined words. Ex. 2. Find verbals and state their syntactical function in th Ex. 3. Analyse noun collocations. | e momentum — скорость изменения цены moving average — скользящая средняя lag - отставание во времени и: 'smoothed - сглаженный о to'oscillate - колебаться ou ei to overlay — наложить e sentence. |

| OSCILLATORS (continued)
Relative Strength Index (RSI) The formula for the RSI is: RSI = 100— 100/[(Up Average/Down Average) + I]. Where: Up Average = The average of closes in a given amount of time that are higher than the previous close. Down = The average of closes in a given amount of time that are lower than the previous close. The RSI is a momentum indicator based upon price movement over a specified period of time created by Welles Wilder. Some of the Droblems that are apparent in other momentum oscillators are eliminated in the RSI. Namely, by taking the up average and down average instead of the difference of prices, a smoother oscillator is created. For example, in a 14-day RSI the up average of the last 14 days is derived, as is the down average of the last 14 days. A constant band is created as well (from 0 to 100) which facilitates analysis of different securities. The RSI is used as any momentum oscillator. Directional movement, peaks, troughs. Divergence and crossing between short term and long term RSI's are looked for in the chart. Overbought/oversold signals are given by crossing the 70 and 30 lines according to Welles Wilder. Instead of focusing only on the crossing of the overbought/oversold line, peaks and troughs of the oscillator should be examined for signals, with peaks expected to be at higher levels in a bull market than in a bear market, troughs occurring at lower levels in a bear market than a bull market. A peak in the RSI would suggest a price turn around to lower levels could be ahead, while a trough in the RSI suggests the opposite. Longer term RSI's will have less vitality than shorter term RSI's, if many overbought/oversold signals are desired, use of a shorter term RSI would generate them, but these will not have the same weight as the less sensitive RSI in terms of medium to long term trends. | Vocabulary |
| e | |
| momentum - скорость движения | |
| i | |
| to eliminate — уничтожать, снимать | |
| u: | |
| smooth — гладкий, ровный | |
| ai | |
| to derive - получать | |
| э: | |
| raw — грубый |
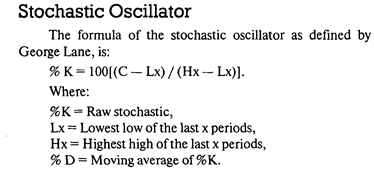
The stochastic recognizes that in an uptrending market the close tends to be near high, while in a downtrending market, the
close is near the lows of the time period. Using the above formula, a "raw" stochastic is found.
A three—day moving average of the "raw" stochastic is used by MMS, as the "raw" stochastic is very volatile, giving false signals. The three—day moving average is called the %K stochastic. A three—day moving average of the %K stochastic is called the %D, which gives a smoother momentum oscillator. This indicator will range between 100 (when the close is equal to the highest high of the last "x" periods) and 0 (when the close is equal to the lowest low of the last "x" periods).
The stochastic is used as any momentum oscillator, with directional movement, peaks, troughs, divergence, crossing between short term and long term stochastics, and crossing between %K and %D stochastics looked for in the chart.
Bollinger Bands—BB
Bollinger Bands are lines charted above and below the moving average of the closing prices. This analysis varies from other percentage band analysis because the distance of each band from the moving average is not fixed. Instead, the price channel these bands form around the moving average is flexible and determined by the user specifying a number of standard deviations.
The standard deviation is the method used to set the band width about the moving average. Bollinger used a 2% standard deviation to capture 95% of prices within the band. However a 1.5 standard deviation is commonly used for futures.
Bollinger Bands automatically narrow and widen in response to volatility — narrow in calm markets, and widen in volatile markets, making them an effective trend indicator.
Bollinger Bands are used with a simple price graph:
Prices near the lower band may signal an overbought market.
Prices near the upper band may signal an oversold market.
The bands often narrow before a sharp move in price. A narrowing of the bands indicates the start of a new trend, which is confirmed when prices break and close out of the band.
A price that breaks above the top band, followed by another that closes within, may signal a reversal and a good time to sell.
A price that breaks below the bottom band, followed by another that closes within, may signal a reversal and a good time to buy.
Example
If prices are moving in a downtrend and hit the bottom of the band, but close back in the bands, indicates that the trend will not continue to go down but sideways and then probably back up.
Bollinger Bands form an area of Support and Resistance and are used to take profits. If prices break above or below the Bands, it results in a changed Support and Resistance. Bollinger Bands do not indicate trading stops.
Directional Movement Index — DMI
The Directional Movement Index (DMI) determines the strength of any upward or downward trends present in the market. It consists of the following four lines:
+DM measures upward movement in price over time. — DM measures downward movement in price over time. DX measures the overall direction of movement
(whether up/down) in price over time. ADX measures the average direction of movement (up/
down) in price over time. In effect it is the average
of the DX.
ADX measures the strength of the trend in the market. The higher the ADX, the stronger the trend present. This index does not measure the direction of the trend. In other words, it is quite common for the ADX to be rising while prices are falling — this indicates an increasing strength in the down trend.
All four lines are plotted on a scale from 0 to 100.
Comprehension questions
1. Where are Bollinger Bands charted?
2. What does the band width show?