
Technical analysis patterns (continued)


| Continuation Patterns (TRIANGLES, PENNANTS, FLAGS, WEDGES,RECTANGLES) | continuation patterns - фигуры продолжения - Vocabulary |
| Э: | ||
| Continuation patterns confirm the continuation of an existing trend. They indicate that a sideway price movement is only a pause in the prevailing conditions. | 'pause e | - пауза, отдых |
| Triangles | ascending | - восходящий |
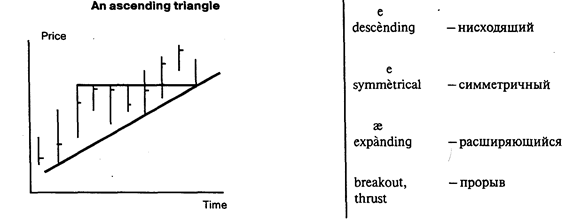
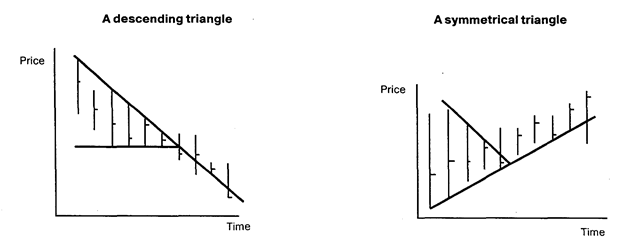
The ascending and descending triangles are price patterns that occur on bar charts and are similar in many respects to the more familiar symmetrical triangle. An ascending triangle is formed by a high. a low, a second high approximately equal to the first high, and a second low which is higher than the first low. For a descending triangle the situation is reversed. This pattern forecasts future price movement because prices are expected to break in the direction of the two equal price levels (to the high side on ascending triangles, and to the low side on descending triangles). In order for the pattern to be valid, two important conditions must be met:
1. Volume and open interest should decline as the triangle forms.
2. The breakout should occur between 1/2 to 3/4 of the distance from the start of the pattern to the apex.
When a breakout occurs, prices should continue in the same direction by an amount equal to the distance from the highest high in the triangle to the lowest low. The symmetrical triangle is seen when highs become lower and lower, and lows become higher and higher, with the resistance and support lines converging. This must be done in nearly a horizontal trend to avoid forming a wedge. Keep in mind that triangles are quite often continuation patterns, see Flags.
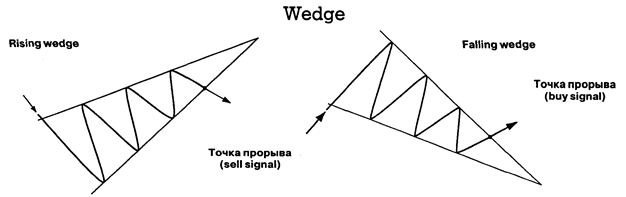
| A wedge pattern on bar charts is similar in certain respects to a symmetrical triangle formation (in fact triangles are some times referred to as wedges). However, wedees have distinct features from triangles: A rising wedge is characterized by a high, a low, a higher high and a higher low. This will give the appearance of an uptrend, but in a wedge the line connecting the highs and the line connecting the lows converge, whereas in a channel they will remain more or less parallel. In a triangle, either the highs or the lows are roughly equal, or else the convergence takes place with no trend implications, as in a symmetrical triangle. It is rising, or falling, nature of the wedge that separates it from the triangle formation. Wedges form most often as a counter-trend consolidation area. This means that during a strong downtrend, a rising wedge will sometimes form as a corrective pattern before the down trend resumes. Thus, a rising wedge has bearish implications, and a falling wedge has bullish implications. After the wedge forms, a breakout is confirmed when prices break the corresponding trendline the lower one in a rising wedge and the upper line in a falling wedge. After the breakout, prices should travel at least as far as the starting point of the formation.
Rectangle |
| |
| Э: | ||
| converge | — сходятся | |
| ei | ||
| implication | — то, что подразумевается | |
| e | ||
| rectangle | — прямоугольник | |
| о | ||
| to resolve | — разрешаться, решаться, | |
| формироваться | ||
| u: | ||
| clue | — указание, наметка | |
| ae | ||
| to validate | -узаконить | |
A common consolidation pattern that occurs on price charts is the rectangle. This technical formation usually occurs at the end of a strong market move, either an uptrend or downtrend, and typically represents a pause in the action. A rectangle is also known as a trading range or a consolidation and is easy to observe because price movements are clearly confined by two parallel lines. A rectangle normally is resolved as a continuation pattern, see Flags. This means that prices should continue in the direction they were moving before the consolidation began. Another clue to the direction of the breakout is the volume pattern within the rectangle. If volume is stronger during the rallies than on the declines, the upside breakout is more probable. The measuring objective after a breakout is determined by the height of the trading range. This distance is added to the level of the breakout point to reach a minimum objective. Similar to a triangle pattern, strong volume is necessary on an upside move to validate the breakout. It is not necessary for a downside breakout.
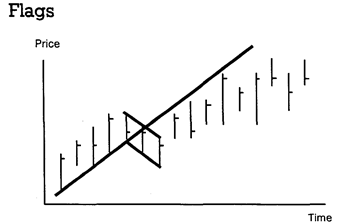
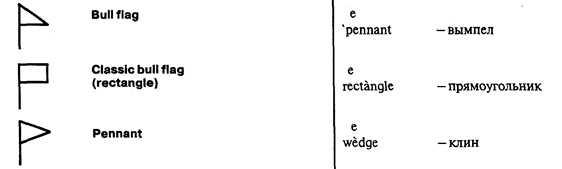
| One of the most reliable of all technical formations is the flag or pennant pattern. These patterns are very similar. Both are formed after a sharp, straight-line move that occurs on heavy volume (either up or down). After the move. a flag is formed by a short, choppv consolidation period. This consolidation is bounded by two parallel lines (rectangle). A pennant is formed after a strong move during a short consolidation period that resembles a small triangle or wedge. Flags and pennats are almost always continuation patterns, and are confirmed when volume declines during the consolidation, then prices break the respective consolidation trendlines on strong volume (i.e., the upper boundary line after an up move, and the lower boundary line after a down move). After the breakout, prices should continue moving by an amount equal to the move that preceded the brief consolidation. In this respect, flags and pennants are said to "fly at half mast". The beginning of the move is usually the point where prices broke out of another chart pattern, or breached important trendline support or resistance.
Pennants A pennant is a fairly common formation, sharing most of its characteristics with flags. Both are formed in dynamic markets. with a "flagpole" formed by an impulsive almost straight line move. A brief period of consolidation results to form the pennants "mast", which is shaped like a small symmetrical triangle. Thereafter, prices move in the direction of the initial impulsive move and for a similar distance, i.e. the mast evolves halfway through the move. Thus to measure the distance of the total move, the length of the flagpole up to the mast is measured and projected from the breakout point of the pennant. | |
| э | |
| 'choppy — часто меняющийся | |
| i: | |
| precede — предшествовать | |
| to fly at half | |
| mast — приспущенный флаг | |
| э | |
| evolve — развертываться , | |
| эволюционировать | |
| е | |
| project — проектировать | |
| Gaps Consecutive transactions can be dealt at significantly different prices. Price gaps that occur within a day's trading do not show up on a bar graph because the graph will show the range for the day. However, if the closing high on one day is below the low of the next day (or one day's low is above the next day's high), a gap actually shows on the bar graph. There are four basic kinds of gap. One, the runaway gap. reflects a continuation of the move. A runaway gan appears after a significant move has already occured. In indicates that the move has received a second wind and is ready to go higher with relative ease. The runaway gap frequently occurs approximately halfway along a major move. Common Gap | e consecutive л runaway as 'gap a second wind | последующий — убегание — скачок усиление |

| Two of the other three kinds of gap, the common gap and the breakaway gap, are important in terms of market reversals. The common gap materializes on one day but subsequently gets filled in. It often is nothing more than the result of thin markets. It is viewed by most practitioners as a false signal, although it can be an indication that the market is leaning to break out in the direction of the gap. The breakaway gap frequently occurs at the end of a con Solidation phase, at the end of a key price pattern, or after a major support, or resistance line has been broken. It usually represents the beginning of a fairlv major move. A breakaway gap is often sharp because those with wrong positions not only will get out of the bad position they are in, but will also establish positions in line with the market move. A breakaway gap may get partially filled in, but mot totally. The fourth kind of gap. an exhaustion gap, occurs near the end of the market move. The market tries to jump forward, but there is little support for the move, and the market quickly retraces. When prices come back through the gap, it is a fairly reliable barometer that the move is over. The exhaustion gap often correlates to the period when small players enter the market. When that happens, in is another signal to be a contrarian and to expect the market to reverse. | ||
| in line with | — в соответствии с | |
| ei | ||
| retrace | — возвращаться по пройденному | |
| пути | ||
| Э: | ||
| correlate | — соответствовать | |
| еэ | ||
| contrarian | — идущий от противного | |
| to fill | - наполнять | |
Islands
Islands are an even more extreme example of a change in market sentiment giving a sharp reversal. An island is formed by at least two gaps. In an uptrend reversal, the first gap is a "break away" as the market opens higher than the previous time periods high, and maintains that gap. The gap is never "filled" in that at least one entire time period is traded above the gap. The reversal occurs when prices fall sharply in a subsequent period, whether it be the next period or many later. The drop has to gap through, leaving an island of price activity clearly defined by at east two gaps, one up, one down. The reverse is tme in a turn of a bear market. Futures markets sometimes have gaps. while 24-hour foreign exchange markets tend to see them less frequently. When seen though, they can be powerful indications of a trend change.
Comprehension Questions
1. What do continuation patterns show?
2. How are ascending and descending triangles for med?
3. How do wedges differ from triangles?
4. When do wedges form a counter trend consolidation area?
5. Why is a rectangle called a trading range?
6. Why is the flag, or pennant pattern one of the most reliable of all technical formations?
7. When does a gap usually show on the bar graph?
8. What kinds of gap do you know?
Exercises
Ex. 1. Put questions to the underlined words and let your partner answer them.
Ex. 2. Describe the market situation using the gaps chart.
Ex. 3. Read and translate the text.
Ex. 4. Select sentences which are difficult to translate and make a syntactical analysis of them.
TRANSLATION PRACTICE
New Concepts in Support and Resistance
In the spot Yen chart (figure 2) the reversal at a.) was violent, once the maximum bullish point was lost it was not seen again. This level later serves to top out a strong rally leaving high order isolated high (an isolated high that has several lower isolated highs in each side of it). Level b.) is nothing like so decisive. Look at the pullback from the high during the second period of the reversal. Level b.) acts as support and rebuffs a subsequent
| downward thrust, but it is not really potent — accordingly it gives up without much of a fight a little later. c.) is similarly weak, and on eventual attack it gives way easily. d.) and e.), however, constitute strong support (d.) and resistance (e.) when retested, as here the potential for getting un- | Vocabulary ou 'potent — мощный |
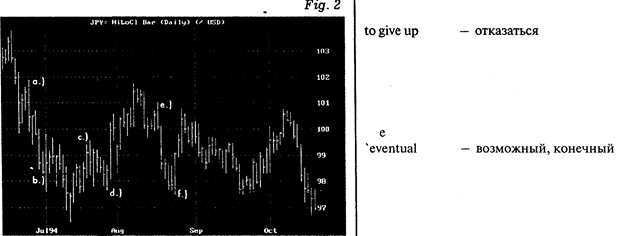
| pleasantly caught was high. Finally we have the classic case of f.) where the reversal sweeps "don't hold hands" and price rallies rapidly and decisively. Accordingly the max bear point level f.) serves to halt a subsequent strong downthrust. The hourly Spot Stg chart (figure 2) shows four reversal Levels that have one property in common, namely they each represent the period of maximum bullishness [b.) and c.)] and bearishness [a.) and d.)] of their structures. (Note the period of maximum bullishness/bearishness should always be looked for in any reversal or consolidation structure.) Whilst in the great majority of cases it is constituted by an isolated high or a two period reversal of the type discussed (high and low of the first period depending on direction of reversal), this is not always the case. Sometimes this point can be "cunninglv" hidden amongst the oscillating price action (eg. "c" in the Stg Hourly chart) yet it will still represent a key level if the area containing it is re-challenged. How long do these horizontal support/resistance levels maintain their influence? When price action reaches key levels it is more common to find price stalling than rushing straight through like a runaway train. This stall mav precipitate a reversal or a consolidation. where the market gathers itself for a decisive push through the price obstacle(s) that has temporarily balked it. When price breaches support/resistance it weakens it, even if by the close we have returned back through the level.
| To precipitate - ускорять |
| to hold one's | |
| hand — воздерживаться от действий, занимать выжидательную позицию | |
| to stall — задерживать | |
| ei | |
| failure — точка неудачи | |
| correlation — оказаться в соотношении |

OSCILLATORS
| Key terms | |
| 1. oscillator | — осциллятор — индикатор, который колеблется между верхней и нижней границами коридора, обозначает сигналы «купи», «продай», указывая разницу между показателями среднего движения курса за короткий и длинный периоды времени. |
| 2. Momentum | — осциллятор, указывающий на скорость изменения цены в сравнении с уровнем самой цены. Разница между ценой инструмента сегодня и ценой в предшествующие периоды. Положительное или отрицательное значение разницы отмечается относительно нулевой линии. |
| 3. Relative Strength Index (RSI) | — осциллятор — индекс, обозначающий силу цены настоящей относительно цены в прошлом. |
| 4. Stochastics | — индикатор скорости изменения цен. На растущем рынке цены при закрытии биржи устремляются вверх, и наоборот, при понижательной рыночной конъюнктуре они падают вниз. |
| Slow stochastics | — дает менее чувствительные показатели движения цен и более предпочтителен для торговцев. Его показатель % К соответствует % D быстрых стохастических линий. |
| Fast stochastics | — индикатор более чувствительный, чем медленные стохастические линии, линия % показывает близость цен закрытия биржи к верхней границе за определенный период. Масштаб измерения — от 0 до 100. Наивысшая цена — 100, самая низкая — 0. % D — вторая линия, специальная линия показателей среднего движения курса % К по различным периодам. Сигнал покупки образует комбинация низкого значения % D и еще более низкого значения % К (менее 20). Сигнал продажи — высокое значение % D и еще более высокое % К (более 80). |
| 5. Moving Average Convergence Divergence (MACD) | — две линии показателей среднего движения курса, колеблющиеся выше и ниже нуля. Первая линия (Conv.) отмечает разницу между показателями среднего курса (MACD W), а вторая является экспонентным показателем среднего курса первой линии (MACD), т.е. сигнальной линией. Если MACD W пересечет сигнальную линию сверху, то возникает сигнал покупки. Если пересечение произойдет с противоположной стороны — то возникает сигнал продажи. Чем пересечение дальше от нуля, тем прогноз надежнее. |
| 6. Moving Average Crossover | — пересечение скользящих средних с коротким и длинным периодом образует две линии показателей среднего движения курса. Если курс с коротким периодом падает ниже курса с длинным периодом и оба курса снижаются, то образуется сигнал продажи. Если курс короткого периода пересекает курс длинного периода снизу и оба курса поднимаются вверх, то образуется сигнал покупки. |
| 7. Bollinger Bands | — линии, наносимые на график выше и ниже скользящей средней цен закрытия. Верхняя и нижняя линии сближаются при спокойной конъюнктуре рынка и расходятся с ростом колебания цен. |
| 8. Directional Movement Index — индекс, образуемый четырьмя индексами и указывающий на силу тренда. | |
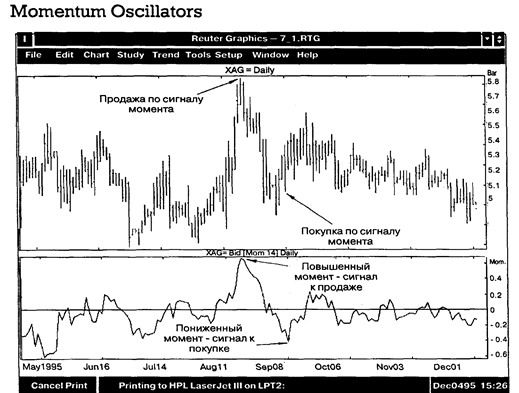
| Momentum oscillators are technical indicators which measure the change in prices over a given time period. These indicators are very useful in trendless or sidewavs trending markets, as well as in trading band conditions. They can also help in oinoointing the turn in trends, whether they be intra-day, weekly, or very long term in nature. During a trending period though, the trend will tend to dominate any signals given by the momentum oscillator. There are three important indications to look for in all momentum oscillators: direction. extreme values and divergence from prices. Direction Momentum oscillators track prices verv well. and can actually lead price direction bv one to two periods. The direction | Vocabulary ae 'value - ценность, цена, сумма э: divergence - отклонение i: to'lead - упреждать crossover — пересечение |
| that momentum oscillators are moving in thus corresponds to the direction in which prices will potentially move. Longer term versus shorter term momentum oscillator analysis provides indication of price direction as well. This is similar to the use of long and short term moving averages for determining nrice direction, in that cross overs are very important. A longer term momentum oscillator is one that uses a larger time period. relative to a medium term momentum oscillator. For example, a 21-day Stochastic would be considered a long term momentum oscillator, compared to a 9-day stochastic, and a 10-bar hourly stochastic would be considered a longer term stochastic in comparison to a 5-bar hourly stochastic. As a rule: "The longer term momentum oscillators have less volatility and thus they will not be subject to the number of false |
| signals that the shorter term momentum oscillators are, making a case for using them in conjunction with each other. The same effect can be generated bv smoothing a same time period oscillator, in effect slowing it down. In this case, a moving average of a momentum oscillator can be compared to the underlying momentum oscillator, and give similar cross over signals as using the longer term/shorter term indicators. Extreme Values An extreme value in the momentum oscillator occurs, when peaks and troughs are evident in the momentum oscillator chart. When the momentum oscillator reaches an extreme value, the trend in prices will generally flatten, and there is potential for a reversal of the prior trend. However, the prevailing trend of price direction is still the major trading factor, and momentum oscillators reaching extreme values is usually a pause in the trend. Areas of extreme value are called overbought levels at momentum oscillator peaks, and oversold levels at momentum oscillator troughs. Both the Relative Strength Index and the Stochastic indicator have predetermined levels where the underlying instrument is considered to be overbought or oversold, but as peaks tend to occur at higher levels in bull markets, troughs at lower levels in bear markets, the use of predetermined levels for overbought/oversold signals is not encouraged. Other momentum oscillators such as the Net Change Oscillator (NCO) or Rate of Change Indicator (ROC) display peaks and troughs as well, but there are no predetermined valuation levels which give overbought/oversold indications. Divergence As prices and momentum oscillators usually trend in the same direction, and momentum oscillators can be used for the timing of price turns, divergence in direction is an important sianal. Divergence occurs when prices continue to trend higher (or lower) and momentum oscillators turn in the opposite direction. This is most significant at new price highs or lows, but keep in mind that chart patterns such as double tops, head and shoulders, etc. can occur when divergence is seen, and one should wait for penetration of kev suooort. or resistance, in order to confirm this turn in the trend. Divergence can be used to tighten stops, or as a strong warning signal that the prevailing trend could be reversing. These three indications are verv important in using momentum oscillators, as used in conjunction with each other thev can help in determining trends and turning points.
Moving Average Spreads (MAS) The formula of the moving average spread is: MAS = shorter moving average - longer moving average Example: (4-day MA) — (18-day MA), or (5-week MA) - (20-week MA). Moving average spreads are derived by taking the difference between two moving averages. Usually one of the moving averages is a short term moving average, while the other can be intermediate, or long term. This difference, or spread, is plotted and used as a momentum oscillator.
| л | |
| 'underlying | - основной | |
| of | ||
| 'trough | — нижняя точка (поддержка) | |
| i: | ||
| 'peak | — высшая точка (сопротивления)
| |
| QT dl | ||
| 'prior | — предшествующий | |
| e | ||
| spread | — разница, разрыв | |
| pre-set | — заранее установленный | |
| ae | ||
| 'magnitude | — величина, значение | |
| to overlay | — наложить | |
Moving average spreads are plotted as any momentum oscillator. Direction, extreme values and divergence are looked for in the chart. If the spread is uptrending, the shorter term moving average must be greater than (above) the longer term moving average. The reverse is true for a downtrending spread. Trading signals are generated when the zero line is crossed, showing a moving average cross over. Thus, moving average spreads are good trend indicators.
Extreme values are a little harder to measure in the moving average spreads as there are no pre-set boundaries. The Relative Strength Indicator and Stochastic Oscillator have maximum and minimum values (100 and 0) and levels at which the market is considered overbought/oversold (70% - 30% and 80%-20%, respectively). The MAS, much like the NCO, does not have either of these pre-determined parameters. It can take on any value, positive or negative, of any magnitude. Analysing historical data of past extreme values is necessary, and then these areas can be used for future reference.
Divergence between MAS direction and security price direction gives early indication of trend change. One measure of trend change that is often used in technical analysis is the crossing of moving averages. Crossing of the moving averages which make up the spread necessarily makes the MAS reach zero. Thus, early warning or confirmation of a change in trend is possible using MAS.
Comprehension Questions
1. What do momentum oscillators measure?