
2. What is the most important factor of a price chart?


3. What factors determine the importance and strength of the trend line?
4. How does the trend line act in bear and bull markets?
5. How can up and down trends be identified?
Trendlines
| The cornerstone of technical analysis theory is that prices discount all known information, and forecasts, and that these prices move in trends. Therefore, the most important factor to determine when looking at a price chart is the direction of the prevailing trend. Trends are evident in all degrees, from intra-day trends in 5-minute bar charts to trends of a few weeks on daily charts, to multi-year trends on weekly and monthly charts. Regardless of magnitude, an uptrend is defined as a series of prices with higher highs and higher lows. A downtrend is most simply a series of lower highs and lower lows. sideways trends also develop and occur when neither an uptrend nor downtrend is evident. In an uptrend, a trendline can be drawn bv connecting increasingly higher lows. while in a down trend a trendline is usually drawn from increasingly lower highs. The importance and strength of the trendline is determined by the length of time the line exists and the number of times that the trendline halts price movement. Thus. the longer the trendline has existed and the more prices bounce off the trendline, the stronger the trend. In a bull market, the trendline will tend to act as price support, in a bear market the trendline will tend to offer price resistance. Supply pressures during a bull market will come into play at support levels. pushing prices up off support as supply diminishes. In a bear market supply will increase on upticks, keeping prices under pressure. Demand acts in the reverse order, increasing on price dips in a bull market, decreasing on price upticks in a bear market. Thus. some technicians (particularly those with an economic bent) will refer to a bull trendline as a supply line. Conversely, during a bear market, resistance will be found along the trendline pushing prices lower and lower. This trendline may be viewed as the demand line. indicating where demand will be insufficient to push prices to higher levels. The preferred method of looking at trends is to know the long term trend, multi-year, and then work to daily of intra-day trends. Channels Once a trendline is established, technicians attempt to identify a price channel which will contain prices. These are most commonly drawn as parallel lines from a significant high (in a downtrend) or a significant low (in an uptrend). Identifying a change in trend can be a simple matter using technical analysis. Any violation of the current trend confirms a change in trend. For instance, a series of consecutive lower lows and lower highs, following a mn-up in price, could indicate a change in the price trend from up to down. Early identification of a change in trend may be signalled bv a price breakout through the trendline and out of the price channel. Trendline and channel drawing is a subiective art, so there are several things to look for to validate the channel penetration. | i technique e to 'penetrate ei to maintain e consecutive as 'magnitude as 'valid i to 'signify
| — метод — проникать — утверждать — последовательный — величина — имеющий силу — указывать | |
|
| |||
| First, it is important that the close penetrates the channel. Penetrations of the high or the low are more often indications of temporary overbought or oversold conditions in the market, rather than a change in trend. Second, the extent of penetration of the close is important. There is a general technical rule of thumb, that 3% of current market price is the minimum amount of penetration through the trendline required to validate the breakout. This should be adjusted to market and trader requirements though. Third, increased volume on the dav of prenetration is considered the final confirmation of a legitimate breakout. | |
| Moving Averages | |
| Moving averages are the most versatile and widely used of all technical indicators. Basically, the averages are a smoothing, or trend following device with a time lag. It is important to note that the averages are a lagging indicator and should be used for confirmation of trend. Moving averages are simply the averages of a set amount of closing price data. For example, if a 9-day average is desired, the closing prices for the last 9 days are added and the total is divided by 9. The most common way to calculate the moving average is to work from the total of the last 9 days' closing prices. Each day the new close is added to the total and the close 10 days back is subtracted. The new total is then divided by the number of days (9). Shorter moving averages e.g. 4-day are more sensitive and hug the price action more closely than the longer averages (30-day, 100-day). One method used to generate trading signals is to look for price action to cross over the moving average. Another way is to use a double crossover method. This means that a buy signal is produced when the shorter (9-day) average crosses above the longer (18-day) and a sell signal occurs when the 9-day crosses below the 18-dav moving average. Although this technique of using two averages together lags the market a bit more than the use of a single average, it will produce fewer whipsaws. Moving averages lag price movements, but this is acceptable as the average will smooth out "noisy" data. Moving averages can be constructed for any period of time one chooses, but the higher number of days averaged, the more sluggish the average becomes. Many commodity traders find that shorter averages, such as the 3-day, tends to be too volatile. They use instead, a combination of averages. A popular combination is the 4, 9 and 18-day averages. For a longer-term indicator, a 30-day average may also be used, along with 50-day averages or longer. As the moving averages are a lagging technical indicator, they will almost never position one in the market at precisely the right time. Instead, they help to take profits from the middle of a trend and hold losses to a minimum. | Vocabulary |
| ae | |
| to validate — устанавливать | |
| to penetrate — проникать | |
| rule of thumb — здравый смысл, опыт | |
| 'moving' averages — скользящие средние | |
| э: | |
| 'versatile — многосторонний гибкий | |
| lag — отставание | |
| to hug — держаться, следовать | |
| э: | |
| to occur — случаться | |
| i | |
| 'whipsaw — мошенничество, двойная | |
| выгода | |
| л 'sluggish — медленный, инертный | |
| ei | |
| to weight — взвешивание компонентов | |
| степени значимости | |
| е | |
| exponential — экспонентный | |
Types of Moving Averages
Although technicians use moving averages as a trend following system, there are various methods used to calculate a moving average. The differences occur due to the weights each day's price is given.
A simple moving average gives each price equal weight, and the average is a simple summation of N number of days divided by N.
A weighted moving average gives each price a different weight relative to its position in time. The most common form of weighted average is to give the first price (most historical) a weight of 1, the second a weight of 2, the third a weight of3, etc. up to the number of days in the average. In this type of average the most recent price has the largest effect on the calculated value.
An exponentially smoothed moving average is calculated by taking the previously calculated value and adding a certain percent of the difference between today's price and the previous calculated value. This type of average gives greater weight to the most recent prices.
Studies have shown that there is no single "ideal type" of moving average or moving average period. Choosing a moving average and testing its profitability, via optimisation studies, continues to be the most popular method.
Exercises
Ex 1. Match the nouns in the left-hand column to the verbs in right-hand column and make up sentences.
| Noun | Verb |
| Pattern | to determine |
| reversal p. | to identify |
| continuation p. | to move out of |
| large p. | to move into |
| small p. | to be (in) complete |
| trend (line) | to reverse |
| upt. | to end |
| down t. | to establish |
| not. | to be in tact |
| sideways t. | to be reversed |
| prevailing t. | to be in place |
| intra-day t. | to be evident |
| multi-year t. | to turn into |
| strong t. | |
| weak t. | |
| full t. | |
| bear t. | |
| long-term t. | |
| short-term t. |
| Price | to push/fall |
| open p. | to move up (down) |
| high | to go |
| low p. | to trend up (down) |
| close p. | rally to |
| watched p. | to climax |
| subsequent p. | to peak |
| lower p. | go sideway |
| higher p. | to retrace 50% |
| price target | to shift from down trend to up trend |
| to gain control | |
| to regain | |
| to rise on strong volume | |
| to bounce off the support line | |
| to turn down | |
| to climb back but fail | |
| to close to... | |
| to close below... | |
| to settle below... | |
| Volume | to increase |
| lowv. | to decrease |
| high v. | to fall |
| strong v. | to rise |
| weak v. | to decline |
| declining v. |
Ex. 2 Translate the dialogue from English into Russian in writing and from Russian into English orally.
Dialogue
1. What do trend lines indicate? Trend lines indicate trend direction
2. What does a trend line join?
To draw a trend line you must join two extremes that are consecutive (and of similar magnitude).
3. In what case is a trend line not valid?
A trend line must not cut across any other price data — else it is not a valid trend line. A trend line should not be drawn just anywhere.
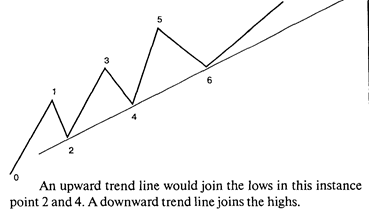
4. How is an upward trend line drawn?
Graphically, an upward trend line is drawn up toward the top right hand side of the Y-scale.
5. How can you idetify up trends?
There are two ways to identify up trends: look for higher highs and higher lows. Look for extreme pivot points. When joining points to produce a trend line in an upward trending market, you join the low points.
6. What does a climax followed by a retest signified? The end of a trend is usually signified by a climax (peak) followed by a retest of one of the extremes (either the high or the low) whilst it is in the ranging stage. Usually the test is of the low if the trend is moving towards a down trend and on the high if the trend is moving upward.
7. How many points does a down trend require?
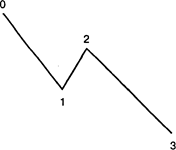
• A down trend requires a minimum of four points.
• It needs a lower low (from I to 3) and a lower high (from O to 2).
8. How is a market sideways trend drawn?
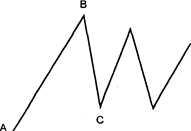
• A sideways market requires two extreme points — in this instance A and B.
• To confirm a sideways market there must be a retest of
one of these extreme points (in this instance the retest is
of the low point C).
9. How many highs does an up trend require?
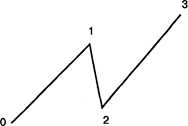
• An up trend requires a minimum of four points.
• It needs a higher low (from 0 to 2) and a higher high (from 1 to 3).
10. What trend indicators do you know?
Tools that can be used to indicate a trend include:
Trend lines, Moving Averages
11. What trend characteristics are identified by price patterns?
Patterns are used to identify the following characteristics about trends:
1. Trend Identification
2. Trend Reversals
3. Trend Continuation
Trend lines are used to determine what type of trend is in force. General theory is, once a trend line is penetrated, it is a signal for consolidating market — in other words it is time for a sideways movement and not an immediate buy or sell signal as often thought.
Ex. 3. Put questions to the underlined words.
Ex. 4. Read and translate the text.
TRANSLATION PRACTICE